Skip to content
NAHB Logo

Eye On Housing

National Association of Home Builders Discusses Economics and Housing Policy

  • Housing Economics Plus
    • Housing Economics Plus Newsletter
    • Become a Plus Member
  • Survey Research
    • Indices
      • HMI
      • HBGI
      • CHI
      • MMS
      • AD&C
      • RMI
    • Books
  • Housing Policy Research
    • Special Studies
    • Housing's Economic Impact
  • Highlights
  • Team
  • Home
  • Construction Statistics

Archives

Categories

  • Builder Finance (34)
  • Construction Statistics (247)
  • Employment/Labor (107)
  • HMI (37)
  • Home Sales and Prices (107)
  • Household Finance (90)
  • Housing Affordability (52)
  • Macroeconomics (135)
  • Multifamily (55)
  • Other Housing Data (75)
  • Policy Research (124)
  • Remodeling (21)
  • Single-Family (107)
  • Top Posts (15)

Construction Statistics

Construction Statistics consists of blogs about starts and permits, construction spending, the Home Building Geography Index (HBGI) and more.

  • Construction Statistics
  • Multifamily
  • Single-Family

Single-Family Starts Trend Higher in September

Robert DietzOctober 18, 2024October 18, 2024

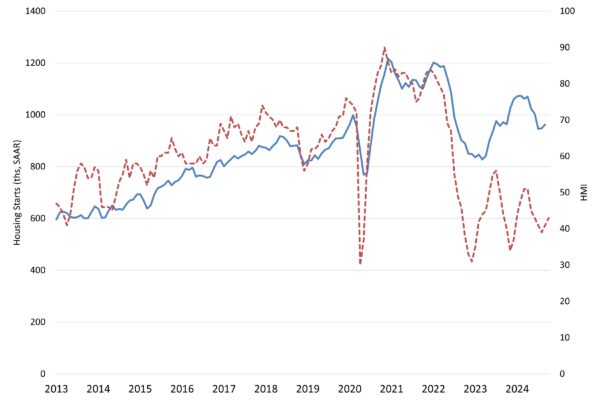
With the Federal Reserve beginning an easing of monetary policy and builder sentiment improving, single-family starts posted a modest gain in September while multifamily construction continued to weaken because of tight financing and an ongoing rise in completed apartments. Overall housing starts decreased 0.5% in…

Read More
  • Construction Statistics

Single-Family Permits Higher in August 2024  

Danushka Nanayakkara-SkillingtonOctober 16, 2024October 22, 2024

Over the first eight months of 2024, the total number of single-family permits issued year-to-date (YTD) nationwide reached 685,923. On a year-over-year (YoY) basis, this is an increase of 11.5% over the August 2023 level of 615,453. Year-to-date ending in August, single-family permits were up…

Read More
  • Construction Statistics
  • Single-Family

Community Associations on the Rise in 2023

Ashok ChaluvadiOctober 15, 2024October 11, 2024

In 2023, 64.8% of all new single-family homes started were built within a community or homeowner’s association. This share increased from the 62.6% recorded in 2022, according to data tabulated from the Census Bureau’s Survey of Construction (SOC). This marks the third highest share since…

Read More
  • Construction Statistics
  • Single-Family

Patios Continue to Crowd Out Decks on New Homes

Paul EmrathOctober 8, 2024October 15, 2024

While the share of new homes with patios continues to climb, the share with decks has hovered at a historic low of under 18%, according to NAHB tabulation of data from the HUD/Census Bureau Survey of Construction (SOC). Every year from the re-design of the…

Read More
  • Construction Statistics
  • Employment/Labor

Strong Job Market in September

Jing FuOctober 4, 2024October 4, 2024

The September jobs report indicates that the U.S. labor market remains strong. Job growth accelerated, and the unemployment rate fell to a three-month low of 4.1%.  Meanwhile, job growth for the previous two months (July and August) was upwardly revised. In September, wage growth accelerated…

Read More
US map showing types of parking facility by division
  • Construction Statistics
  • Single-Family

Parking Garages for New Homes 2023

Catherine KohOctober 4, 2024September 30, 2024

In 2023, 66% of newly completed single-family homes featured two-car garages, according to NAHB’s analysis of the Census’s Survey of Construction data. This was the most common parking option across all Census divisions. By Census division, South Atlantic had the highest share of two-car garages at…

Read More
  • Construction Statistics

Private Residential Construction Spending Falls for Third Straight Month

Na ZhaoOctober 1, 2024October 2, 2024

Private residential construction spending fell 0.3% in August, according to the Census Construction Spending data. Nevertheless, it remained 2.7% higher compared to a year ago. The monthly decline in total private construction spending for August was largely due to reduced spending on single-family and multifamily…

Read More
  • 1
  • 2
  • 3
  • …
  • 36

Subscribe to Blog via Email

Categories

Archives

Eye on the Economy Newsletter

Get bi-weekly insights from NAHB's chief economist on recent housing and economic activity.

Subscribe

Upcoming NAHB Economic Presentations

Map

  • October 16 - Home Builders Association of Topeka
  • October 17 - Building Industry Association of Lancaster County
  • October 24 - Lousiana Home Building Association
  • October 24 - Home Builders Association of Northern Colorado
  • October 24 - Builders Association of Central Florida
  • October 29 - Home Builders Association of the Sioux Empire
  • October 30 - Anchorage Home Builders Association
  • November 7 - Building Industry Association of Stark and East Central Ohio
  • November 13 - Building Industry Association of Southern Indiana
  • November 13 - North Carolina Home Builders Association

To schedule a presentation for your group, please contact: econ@nahb.org

Wells Fargo Ad

NAHB Economics

1201 15th St NW, Washington, DC 20005
econ@nahb.org
  • NAHB
  • Housing Economics
  • NAHBNow Blog
  • The International Builders’ Show