Skip to content
NAHB Logo

Eye On Housing

National Association of Home Builders Discusses Economics and Housing Policy

  • Housing Economics Plus
    • Housing Economics Plus Newsletter
    • Become a Plus Member
  • Survey Research
    • Indices
      • HMI
      • HBGI
      • CHI
      • MMS
      • AD&C
      • RMI
    • Books
  • Housing Policy Research
    • Special Studies
    • Housing's Economic Impact
  • Highlights
  • Team
  • Home
  • Policy Research

Archives

Categories

  • Builder Finance (34)
  • Construction Statistics (247)
  • Employment/Labor (107)
  • HMI (37)
  • Home Sales and Prices (107)
  • Household Finance (90)
  • Housing Affordability (52)
  • Macroeconomics (134)
  • Multifamily (55)
  • Other Housing Data (75)
  • Policy Research (124)
  • Remodeling (21)
  • Single-Family (107)
  • Top Posts (15)

Policy Research

  • Policy Research
  • Single-Family

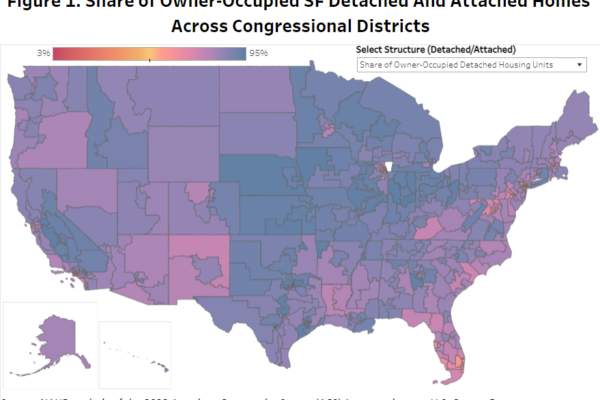
Owner-Occupied Single-Family Housing Units Across Congressional Districts

Jing FuOctober 28, 2024October 28, 2024

With elevated interest rates and rising home prices, 103.5 million households in the United States cannot afford a $495,750 median-priced new home. The growing affordability crisis makes housing a top issue for voters in the 2024 presidential election. Both presidential candidates have offered housing policy…

Read More
  • Other Housing Data
  • Policy Research

Mortgage-Free Homeowners by Congressional Districts

Na ZhaoOctober 25, 2024October 25, 2024

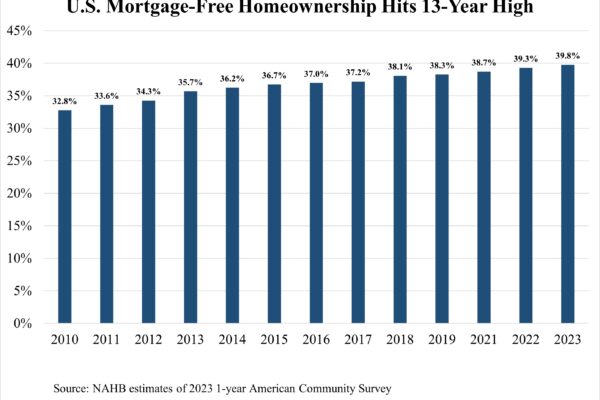
As of 2023, nearly 40% of homeowners in the United States are mortgage-free, the highest level seen in the past 13 years. With elections approaching, it is valuable to analyze the share of mortgage-free homeowners across congressional districts, as these patterns often provide insights into…

Read More
  • Other Housing Data
  • Policy Research

Second Homes by Congressional Districts

Na ZhaoOctober 24, 2024October 24, 2024

In 2023, the total number of second homes was 5.7 million, accounting for 4% of the total housing stock, according to NAHB estimates of the 2023 American Community Survey. Second homes have been in a steady decline over the past few years, from 7.15 million…

Read More
  • Housing Affordability
  • Policy Research

Housing Cost Burdens Across Congressional Districts

Natalia SiniavskaiaOctober 23, 2024October 23, 2024

While the lack of affordable housing dominates the headlines across the nation, congressional districts with higher shares of renter households are disproportionately affected by the current affordability crisis. Geographically, the districts with the largest housing cost burdens are heavily concentrated in California, Florida, and the…

Read More
  • Policy Research

Travel Time to Work Across Congressional Districts

Jing FuOctober 22, 2024October 22, 2024

Nationally, nearly 140 million people in the United States routinely commuted to work, according to NAHB analysis of the 2023 American Community Survey data. Among these people, approximately 23.8 million people spent more than 90 minutes each day going to and from their place of…

Read More
  • Policy Research

Minority Homeownership by Congressional District

Catherine KohOctober 21, 2024October 21, 2024

Homeownership is an important voter issue for the upcoming election with both presidential candidates putting forth housing policies to tackle the housing affordability crisis. In a recent NAHB post, the national homeownership rate sat at 65%, but there are large disparities in homeownership when broken…

Read More
  • Policy Research

Residential Clean Energy Credit Usage

Jesse WadeOctober 21, 2024October 21, 2024

Nearly 1.3 million tax returns filed for tax year 2023 utilized the Residential Clean Energy Credit (25D tax credit), according to the latest IRS clean energy tax credit statistics. Through May 23rd of the 2024 tax filing season for 2023 returns, almost 138 million tax…

Read More
  • 1
  • 2
  • 3
  • …
  • 18

Subscribe to Blog via Email

Categories

Archives

Eye on the Economy Newsletter

Get bi-weekly insights from NAHB's chief economist on recent housing and economic activity.

Subscribe

Upcoming NAHB Economic Presentations

Map

  • October 16 - Home Builders Association of Topeka
  • October 17 - Building Industry Association of Lancaster County
  • October 24 - Lousiana Home Building Association
  • October 24 - Home Builders Association of Northern Colorado
  • October 24 - Builders Association of Central Florida
  • October 29 - Home Builders Association of the Sioux Empire
  • October 30 - Anchorage Home Builders Association
  • November 7 - Building Industry Association of Stark and East Central Ohio
  • November 13 - Building Industry Association of Southern Indiana
  • November 13 - North Carolina Home Builders Association

To schedule a presentation for your group, please contact: econ@nahb.org

Wells Fargo Ad

NAHB Economics

1201 15th St NW, Washington, DC 20005
econ@nahb.org
  • NAHB
  • Housing Economics
  • NAHBNow Blog
  • The International Builders’ Show