Skip to content
NAHB Logo

Eye On Housing

National Association of Home Builders Discusses Economics and Housing Policy

  • Housing Economics Plus
    • Housing Economics Plus Newsletter
    • Become a Plus Member
  • Survey Research
    • Indices
      • HMI
      • HBGI
      • CHI
      • MMS
      • AD&C
      • RMI
    • Books
  • Housing Policy Research
    • Special Studies
    • Housing's Economic Impact
  • Highlights
  • Team
  • Home
  • state and local markets
  • Page 3

Archives

Categories

  • Builder Finance (34)
  • Construction Statistics (247)
  • Employment/Labor (107)
  • HMI (37)
  • Home Sales and Prices (107)
  • Household Finance (90)
  • Housing Affordability (52)
  • Macroeconomics (135)
  • Multifamily (55)
  • Other Housing Data (75)
  • Policy Research (124)
  • Remodeling (21)
  • Single-Family (107)
  • Top Posts (15)

state and local markets

  • Construction Statistics

Single-Family Permits Performing Well in February 2024

Danushka Nanayakkara-SkillingtonApril 12, 2024May 7, 2024

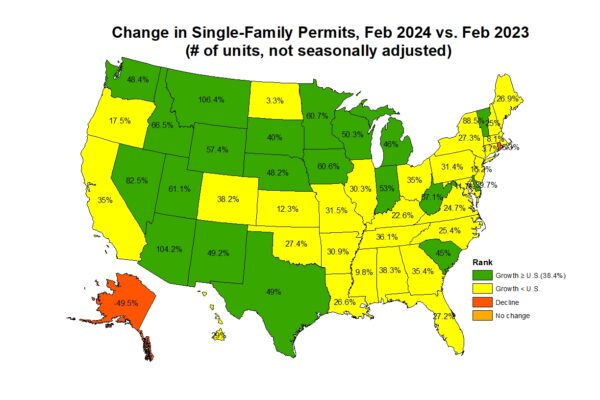
Over the first two months of 2024, the total number of single-family permits issued year-to-date (YTD) nationwide reached 155,236. On a year-over-year (YoY) basis, this is an increase of 38.4% over the February 2023 level of 112,131. Year-to-date ending in February, single-family permits were up…

Read More
  • Macroeconomics

2023 State-Level GDP Data

Danushka Nanayakkara-SkillingtonMarch 29, 2024May 7, 2024

Real gross domestic product (GDP) increased in 49 states and the District of Columbia in 2023 according to the U.S. Bureau of Economic Analysis (BEA). Delaware is the only state to report an economic contraction last year. The percent change in real GDP ranged from a…

Read More
  • Employment/Labor

State Level Employment Situation: February 2024

Danushka Nanayakkara-SkillingtonMarch 22, 2024May 7, 2024

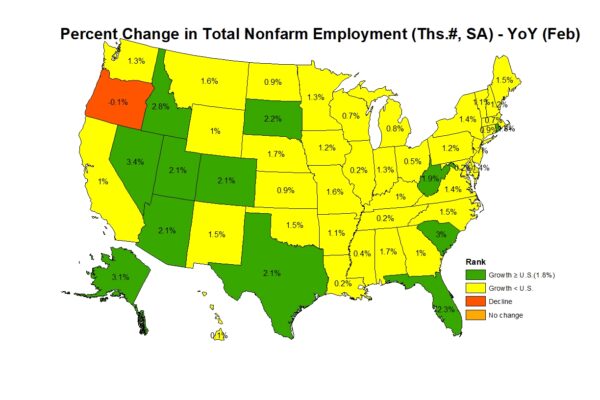
Nonfarm payroll employment increased in 43 states and the District of Columbia in February compared to the previous month, while seven states saw a decrease. According to the Bureau of Labor Statistics, nationwide total nonfarm payroll employment increased by 275,000 in February, following a gain…

Read More
  • Construction Statistics

Strong Rebound in Single-Family Permits at the Start of 2024

Danushka Nanayakkara-SkillingtonMarch 15, 2024May 7, 2024

Over the first month of 2024, the total number of single-family permits issued year-to-date (YTD) nationwide reached 75,906. On a year-over-year (YoY) basis, this is an increase of 43.1% over the January 2023 level of 53,062. Year-to-date ending in January, single-family permits were up in…

Read More
  • Employment/Labor

Job Growth Continues to be Strong Across Most States at the Start of 2024

Danushka Nanayakkara-SkillingtonMarch 11, 2024May 7, 2024

Nonfarm payroll employment increased in 42 states and the District of Columbia in January compared to the previous month, while eight states saw a decrease. According to the Bureau of Labor Statistics, nationwide total nonfarm payroll employment increased by 229,000 in January, following a gain…

Read More
  • Construction Statistics

Single-Family and Multifamily Permits Down in 2023

Danushka Nanayakkara-SkillingtonFebruary 14, 2024May 7, 2024

Over 2023, the total number of single-family permits issued year-to-date (YTD) nationwide reached 909,227. On a year-over-year (YoY) basis, this is 6.5% below the December 2022 level of 972,180. Year-to-date ending in December, single-family permits declined in all four regions. The range of permit decline…

Read More
  • Employment/Labor

Employment Situation in December: State-Level Analysis

Danushka Nanayakkara-SkillingtonJanuary 23, 2024June 20, 2024

Nonfarm payroll employment increased in 39 states and the District of Columbia in December compared to the previous month, while 11 states saw a decrease. According to the Bureau of Labor Statistics, nationwide total nonfarm payroll employment increased by 216,000 in December, following a gain…

Read More
  • 1
  • 2
  • 3
  • 4
  • 5
  • …
  • 12

Subscribe to Blog via Email

Categories

Archives

Eye on the Economy Newsletter

Get bi-weekly insights from NAHB's chief economist on recent housing and economic activity.

Subscribe

Upcoming NAHB Economic Presentations

Map

  • October 16 - Home Builders Association of Topeka
  • October 17 - Building Industry Association of Lancaster County
  • October 24 - Lousiana Home Building Association
  • October 24 - Home Builders Association of Northern Colorado
  • October 24 - Builders Association of Central Florida
  • October 29 - Home Builders Association of the Sioux Empire
  • October 30 - Anchorage Home Builders Association
  • November 7 - Building Industry Association of Stark and East Central Ohio
  • November 13 - Building Industry Association of Southern Indiana
  • November 13 - North Carolina Home Builders Association

To schedule a presentation for your group, please contact: econ@nahb.org

Wells Fargo Ad

NAHB Economics

1201 15th St NW, Washington, DC 20005
econ@nahb.org
  • NAHB
  • Housing Economics
  • NAHBNow Blog
  • The International Builders’ Show