Skip to content
NAHB Logo

Eye On Housing

National Association of Home Builders Discusses Economics and Housing Policy

  • Housing Economics Plus
    • Housing Economics Plus Newsletter
    • Become a Plus Member
  • Survey Research
    • Indices
      • HMI
      • HBGI
      • CHI
      • MMS
      • AD&C
      • RMI
    • Books
  • Housing Policy Research
    • Special Studies
    • Housing's Economic Impact
  • Highlights
  • Team
  • Home
  • state and local markets
  • Page 2

Archives

Categories

  • Builder Finance (34)
  • Construction Statistics (247)
  • Employment/Labor (107)
  • HMI (37)
  • Home Sales and Prices (107)
  • Household Finance (90)
  • Housing Affordability (52)
  • Macroeconomics (135)
  • Multifamily (55)
  • Other Housing Data (75)
  • Policy Research (124)
  • Remodeling (21)
  • Single-Family (107)
  • Top Posts (15)

state and local markets

  • Employment/Labor

State Level Employment Situation: May 2024

Danushka Nanayakkara-SkillingtonJune 25, 2024June 25, 2024

Nonfarm payroll employment increased in 41 states and the District of Columbia in May compared to the previous month, while nine states saw a decrease. According to the Bureau of Labor Statistics, nationwide total nonfarm payroll employment increased by 272,000 in May, following a gain…

Read More
  • Policy Research

State & Local Tax Revenues: 2024 First Quarter Analysis

Jesse WadeJune 24, 2024June 24, 2024

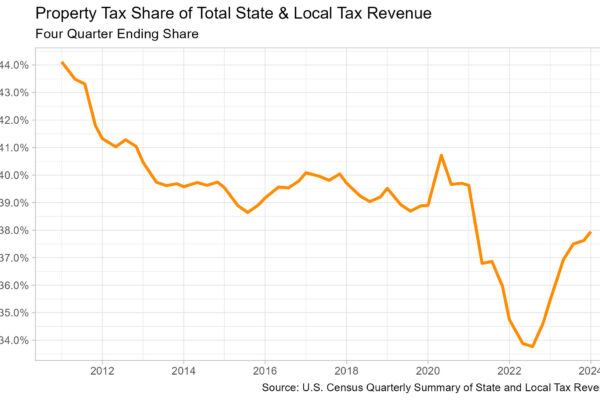
The Census Bureau’s quarterly summary of State & Local Tax Revenue shows a 1.7% increase in property taxes paid, rising from a revised estimate of $754.1 to $766.7 billion in the seasonally adjusted four quarters ending in the first quarter of 2024. The rate of…

Read More
  • Construction Statistics

Single-Family Permits Holding Steady in April 2024  

Danushka Nanayakkara-SkillingtonJune 18, 2024June 18, 2024

Over the first four months of 2024, the total number of single-family permits issued year-to-date (YTD) nationwide reached 336,124. On a year-over-year (YoY) basis, this is an increase of 25.3% over the April 2023 level of 268,205. Year-to-date ending in April, single-family permits were up…

Read More
  • Employment/Labor

Home Building Employment across States and Congressional Districts in 2022

Natalia SiniavskaiaMay 30, 2024May 15, 2024

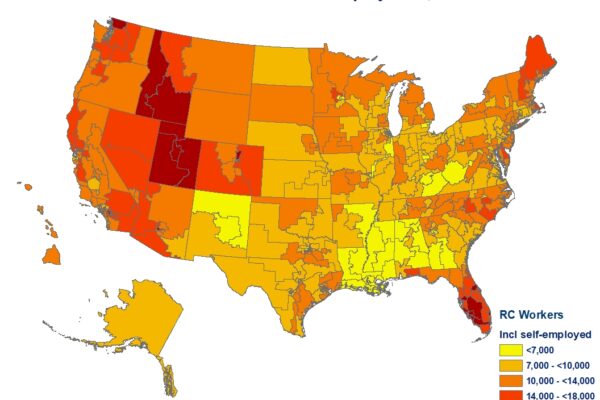
According to the latest 2022 ACS, 11.2 million people, including self-employed workers, worked in construction in 2022. NAHB estimates that out of this total, 4.7 million people worked in residential construction, accounting for 2.9% of the US employed civilian labor force. Home building in the…

Read More
  • Employment/Labor

State Level Employment Situation: April 2024

Danushka Nanayakkara-SkillingtonMay 17, 2024May 17, 2024

Nonfarm payroll employment increased in 38 states and the District of Columbia in April compared to the previous month, while 11 states saw a decrease. Alaska reported no change during this time. According to the Bureau of Labor Statistics, nationwide total nonfarm payroll employment increased…

Read More
  • Construction Statistics

Single-Family Permits Up in March 2024  

Danushka Nanayakkara-SkillingtonMay 14, 2024May 13, 2024

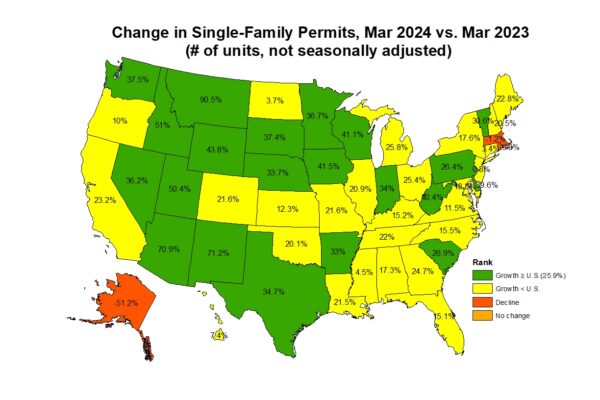
Over the first three months of 2024, the total number of single-family permits issued year-to-date (YTD) nationwide reached 241,311. On a year-over-year (YoY) basis, this is an increase of 25.9% over the March 2023 level of 191,695. Year-to-date ending in March, single-family permits were up…

Read More
  • Employment/Labor

State Level Employment Situation: March 2024

Danushka Nanayakkara-SkillingtonApril 19, 2024May 7, 2024

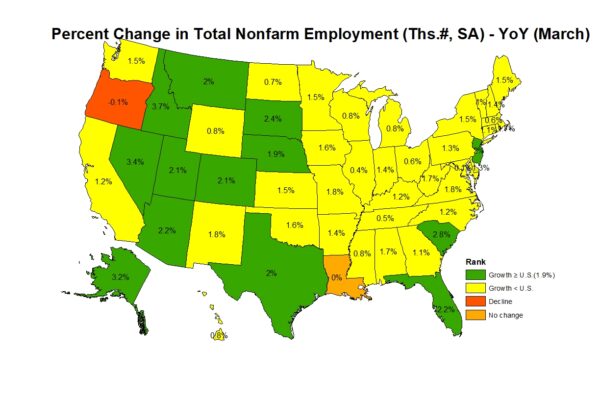
Nonfarm payroll employment increased in 44 states in March compared to the previous month, while six states and the District of Columbia saw a decrease. According to the Bureau of Labor Statistics, nationwide total nonfarm payroll employment increased by 303,000 in March, following a gain…

Read More
  • 1
  • 2
  • 3
  • 4
  • …
  • 12

Subscribe to Blog via Email

Categories

Archives

Eye on the Economy Newsletter

Get bi-weekly insights from NAHB's chief economist on recent housing and economic activity.

Subscribe

Upcoming NAHB Economic Presentations

Map

  • October 16 - Home Builders Association of Topeka
  • October 17 - Building Industry Association of Lancaster County
  • October 24 - Lousiana Home Building Association
  • October 24 - Home Builders Association of Northern Colorado
  • October 24 - Builders Association of Central Florida
  • October 29 - Home Builders Association of the Sioux Empire
  • October 30 - Anchorage Home Builders Association
  • November 7 - Building Industry Association of Stark and East Central Ohio
  • November 13 - Building Industry Association of Southern Indiana
  • November 13 - North Carolina Home Builders Association

To schedule a presentation for your group, please contact: econ@nahb.org

Wells Fargo Ad

NAHB Economics

1201 15th St NW, Washington, DC 20005
econ@nahb.org
  • NAHB
  • Housing Economics
  • NAHBNow Blog
  • The International Builders’ Show